
The immediate success of the SpaceX IPO would suggest that the market is going heavily “risk on”. Elon Musk has recently been crowned as the World’s first trillionaire. After pricing the stock at $135 per share, it has traded to a high of $222. That move placed it above Microsoft and made it the 4th most valuable company in the world at close to $3T. It is surpassed only by Nvidia, Alphabet (Google) and Apple (graph below). This achievement is all the more startling when comparing the financials of the companies based on their last reported quarter:
| Company | Revenues | Net Income | YoY Rev Growth Rate |
| SpaceX | $4.7B | -$4.3B | 15% |
| Nvidia | $81.6B | $58.3B | 85% |
| Alphabet | $109.9B | $62.6B | 22% |
| Apple | $111.2B | $29.6B | 17% |
| Microsoft | $82.9B | $31.8B | 18% |
SpaceX generates only a fraction of the revenues that its main competitors (from a market cap perspective) achieve whilst also having the slowest growth rate. The other companies also feature exceptionally high net income margins for their business models whereas SpaceX still loses money. Extreme amounts of capital moving into SpaceX suggests that the market is feeling in a risk on mood. This could potentially bode well for the upcoming IPOs of Anthropic and OpenAI, provided that the risk sentiment remains high.
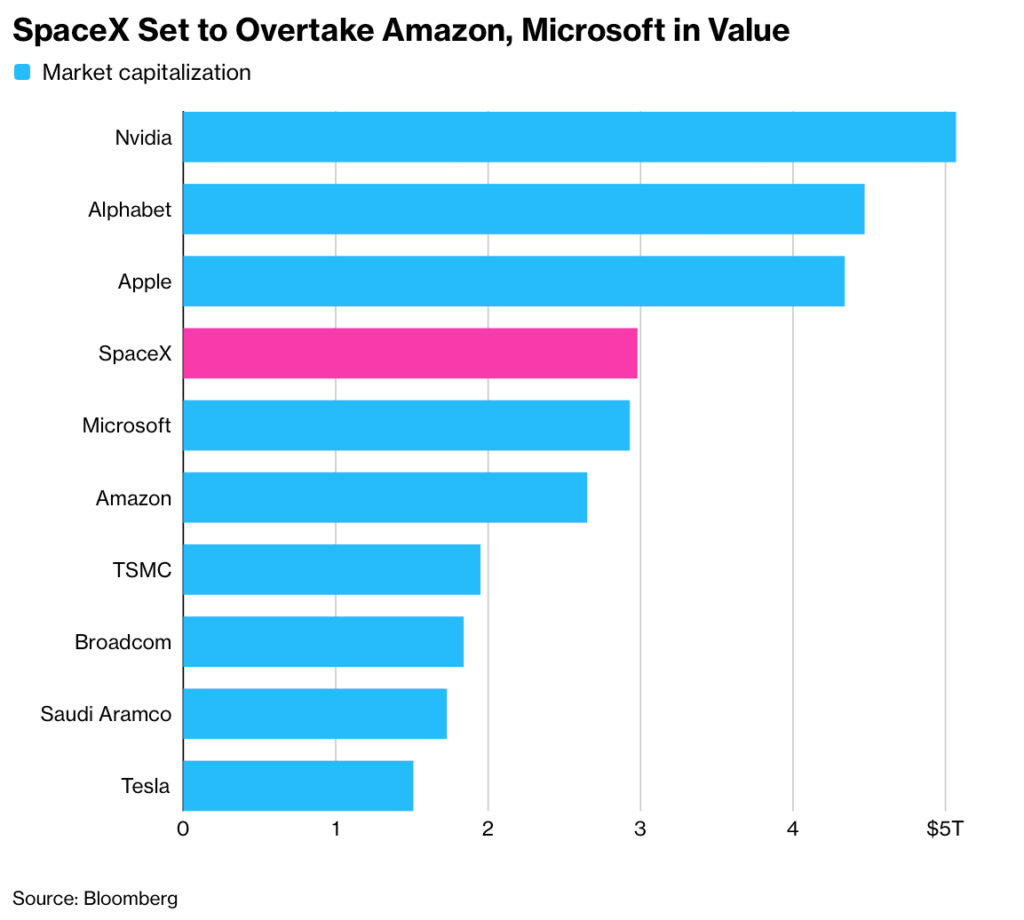
Unsurprisingly, the key driver of SpaceX’s massive ascent has been retail investors. According to data from Vanda Research, “Retail traders have been a key driver of the rally, buying as much SpaceX stock over its first two days of trading as they purchased across the entire US stock market last week.”
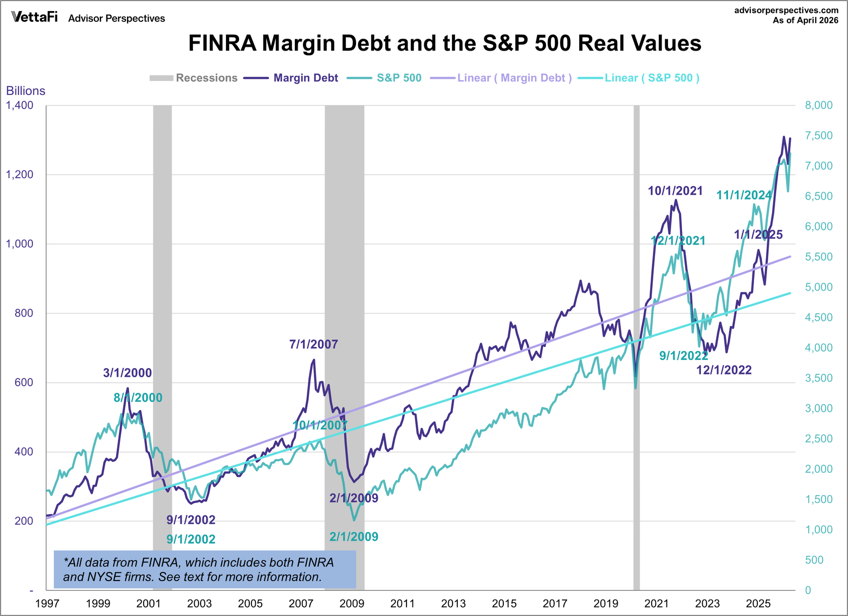
One of the key risks to the stock market is that retail investors, in particular, are increasingly relying on margin debt to fund their purchases (below). Trading with a margin debt can magnify gains because investors can benefit from the upside of any stock without having to invest 100% of the total cost which results in greater profits when the stock goes up from the purchase price. On the other hand, trading with margin debt can also exacerbate losses because if a stock’s value were to depreciate, the investor may face a margin call and would need to come up with additional cash to reach the minimum requirement. Margin debt is often seen as a measure of investor sentiment and risk appetite. High levels of margin debt can signal confidence, but extreme spikes may also indicate excessive speculation, increasing the risk of market instability. Currently, it is estimated that margin debt has reached $1.3T, up 53% YoY. As the chart below indicates, margin debt is actually growing faster than the stock market, suggesting risk on pullbacks, especially for the high growth, speculative names that retail investors generally favour right now.
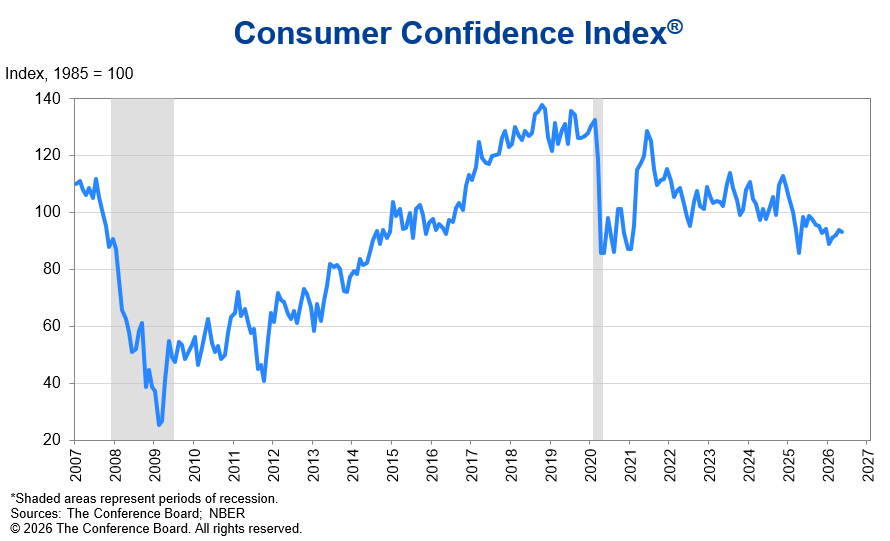
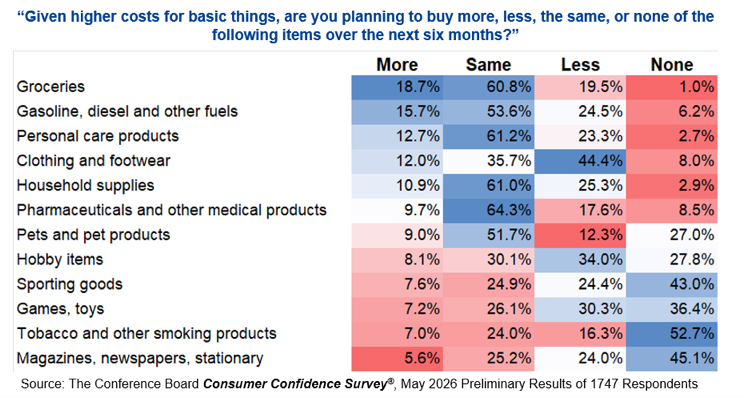
While the market is somewhat buffered from consumers because of its concentration within high income groups, it cannot avoid economic disruption indefinitely because about 70% of economic activity is tied to consumer spending. Consumer Confidence has been waning for some time (below, first). This is showing up in surveys of expected spending patterns (below, second). A recent Conference Board Survey of consumers showed a 66.5% to 7.4% ratio between consumers expecting to cut back on spending versus increase spending (26% said there would be no change). One of the striking findings in this survey was the fact that decreased spending was expected across the board, even for non-discretionary items such as groceries and medical supplies.
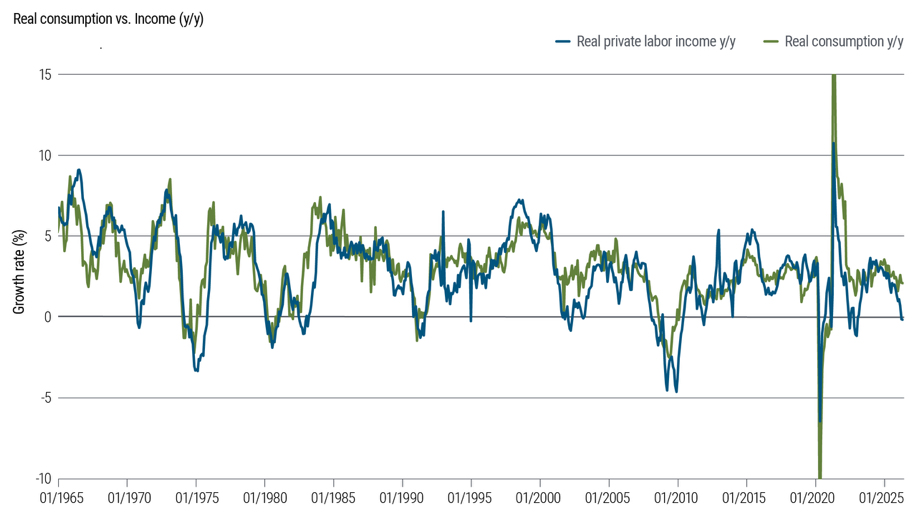
One of the reasons for this pessimism may be that consumers are starting to feel the effects of inflation. In the last year, the gap between real consumption and real income has been widening (below). According to Pimco (one of the largest fixed income fund managers in the world):
“First, already historically low household savings rates suggesting household buffers are more limited. The personal saving rate fell to 2.6% of disposable income as of April, according to the BEA. Outside of the period leading up to the global financial crisis and the 2022 energy shock, the saving rate has rarely been this low in data going back to 1960. The only other period of sustained low household savings rate was the 2004-2006 period when housing debt was rapidly increasing.
Second, the income shock is not a single temporary factor, but rather a series of shocks over the past few years that could be permanently altering expectations of future real earnings. Labor market conditions are the primary channel through which households form income expectations. And although we’ve more recently seen encouraging signs that labor market activity is stabilizing or even picking up over the last few years, a growing degree of labor market slack has been evident across indicators. The ratio of job openings to the number of unemployed workers is hovering around 1.0 as of April, according to the BLS – historically the vacancies to unemployment (V/U) ratio doesn’t tend to fall below 1 outside of recessions. The quits rate is below pre-pandemic levels, and consumer surveys of labor market conditions – including the Conference Board’s “jobs plentiful” versus “jobs hard to get” measure – have continued to gradually decline, suggesting workers feel less confident about outside options and labor market conditions more generally. Measures of wage inflation have also gradually declined, especially for lower paying jobs.”
Fraying consumer confidence is a signal worth watching, especially if it spreads to higher income groups.
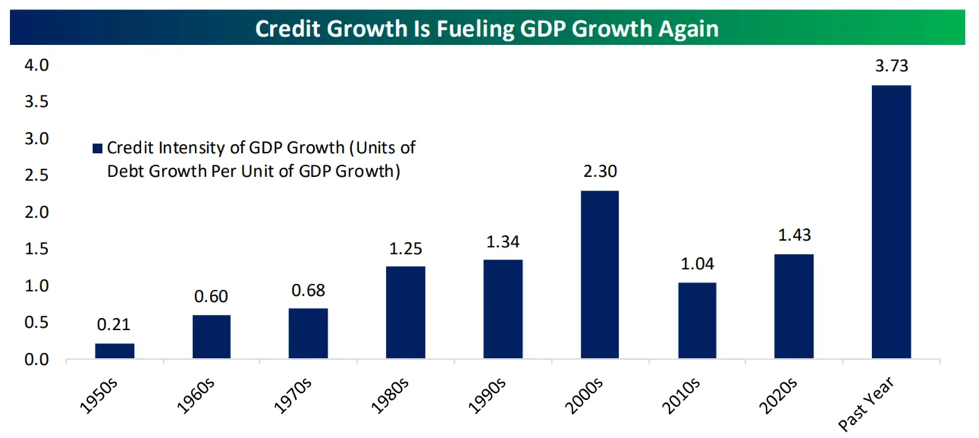
The debt issue extends beyond consumers. Credit intensity has been rising recently. In other words, GDP growth is becoming more dependent on credit than in prior years. The graph below highlights the recent rise in credit growth (note: it includes household and corporate debt). The sharp increase is most likely attributable to the sudden switch in AI buildout funding from cash flows to debt issuance as the costs continue to rise and the pace accelerates. Debt-fueled growth has a very dubious history. Japan and China have both suffered through extended periods of credit intensive growth and speculation followed by periods of stagnation. According to the Bespoke Investment Group, “The economy has shifted to a higher reliance on debt growth. In addition to concerns over sustainability, this dynamic also suggests that the Fed may need to get more aggressive in any effort to fight inflation. The debt deleveraging of the private sector has shifted from an inflation headwind to a re-leveraging tailwind as credit chases output.”
The biggest risk to investors lies in the assumption that massive AI spending will lead to productivity growth that produces a return on investment that far exceeds the borrowing costs. At this point, there is no way to assess whether this bet will pay off.
Investor Takeaway:
While all the signs point to the US entering a period of a “risk on” market, investors should be careful with letting their portfolios get too exposed to a single trade idea, no matter how compelling. As more high-profile AI-based companies go public, the market will be asked to re-allocate or borrow funds to support these IPOs and inevitable debt issuances as the money has to come from somewhere. The contrarian trade will be to look for opportunities that have been beaten up because they are being used as a source of cash. Even if AI proves to be a game changing technology, it is likely that it will go through periods of growth and retraction as has been the case with most other tech revolutions (i.e. PCs, cell phones and the internet). Inevitably, there will be some companies that thrive whilst others fall to the wayside. Managing portfolio risk is prudent for all investors except perhaps those investors with an aggressive, high-risk tolerance.