
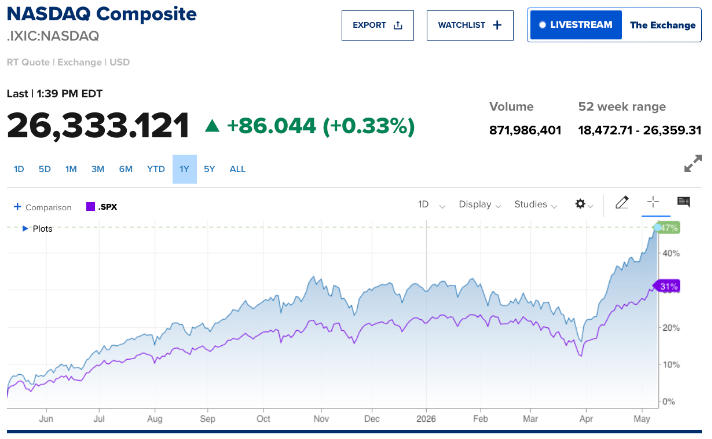
A quick glance at news headlines over the last 12 months would probably lead most rational independent observers to assume that stock markets have had a rough go of things. After all, there have been countless tariff announcements, indications that NATO and other allies are moving away from US influence, high inflation, poor consumer confidence, and, of course, the War on Iran with its severe effects on oil markets globally among other “disruptions”. Despite all this turmoil, stock markets in the US continue to make new highs with the S&P up ~8.5% YTD and NASDAQ up 13.2% (below). The NASDAQ is up over 50% from its April 2025 low. This begs the question, why do markets continue to rise despite all the bad news?
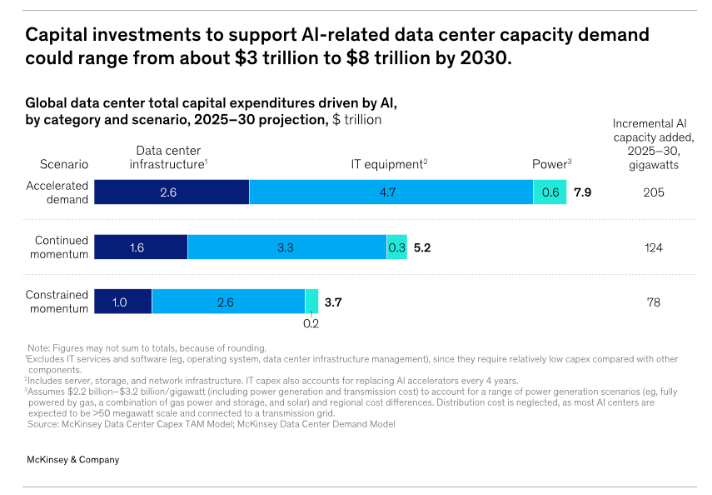
The standard interpretation given by most market observers is that markets are forward looking. They are discounting current headlines and expecting that worst case scenarios will be avoided. It is often said that investors are focusing on accelerating earnings and the AI boom whilst assuming that tariffs and Middle Eastern conflicts are short term in nature. These arguments have merit. It is undeniable that AI Capex is likely to have a profound effect on GDP over the next 5 years. Mckinsey estimates that Capex spend will average between $750B (low case) and $1.6T annually (below). Given that current US GDP is around $32T, this spending accounts for 1.6-5% of annual GDP.
Likewise, earnings for the S&P 500 are expected to grow at an accelerated pace. Factset states that for Q2 2026 through Q4 2026, analysts are calling for earnings growth rates of 19.9%, 23.2%, and 20.7%, respectively. For CY 2026, analysts are predicting (year-over-year) earnings growth of 21.0%. This is truly remarkable growth in the short run.
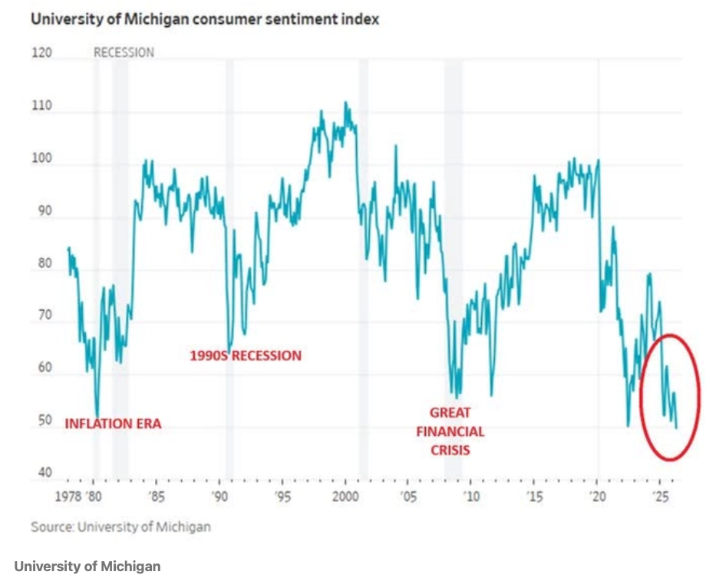
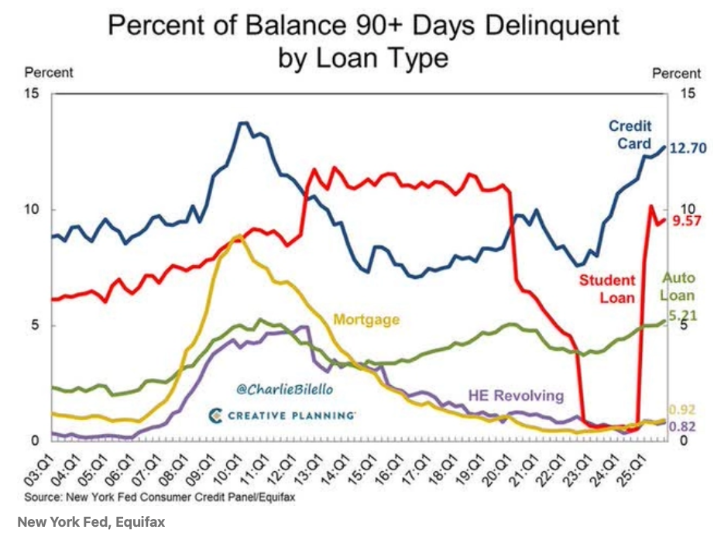
Despite these positive data points, there are an equal number of causes for concern. Consumer sentiment is at an all-time low (since 1978, below, top). Right now, it is lower than during the Great Financial Crisis, 1990’s recession and COVID lows. The negative sentiment is not surprising given that consumers are feeling very stretched. This is evidenced by the rising delinquencies across all personal loan types (below, bottom).
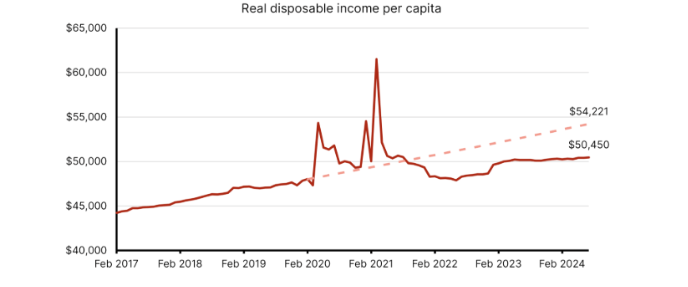
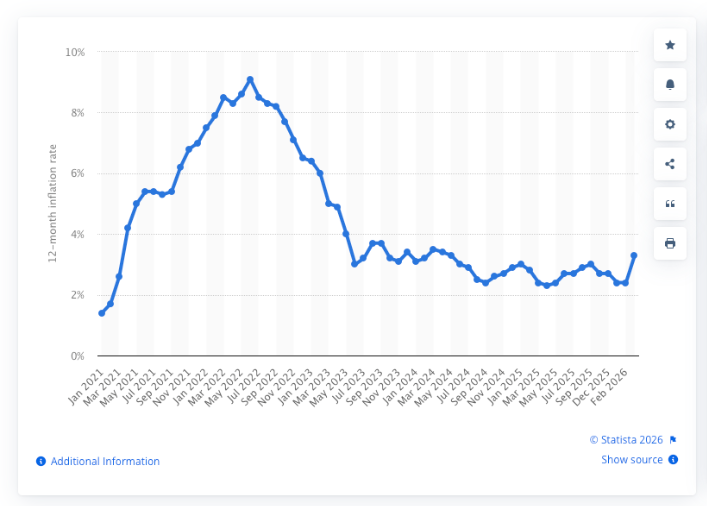
Average consumers are beginning to feel the effects of inflation. This is not a new phenomenon but seems to have accelerated. The average American has been losing buying power for some time now (below, top). If anything, this trend is widening as inflation has remained well above the Fed’s 2% target for the last 5 years (below, bottom).
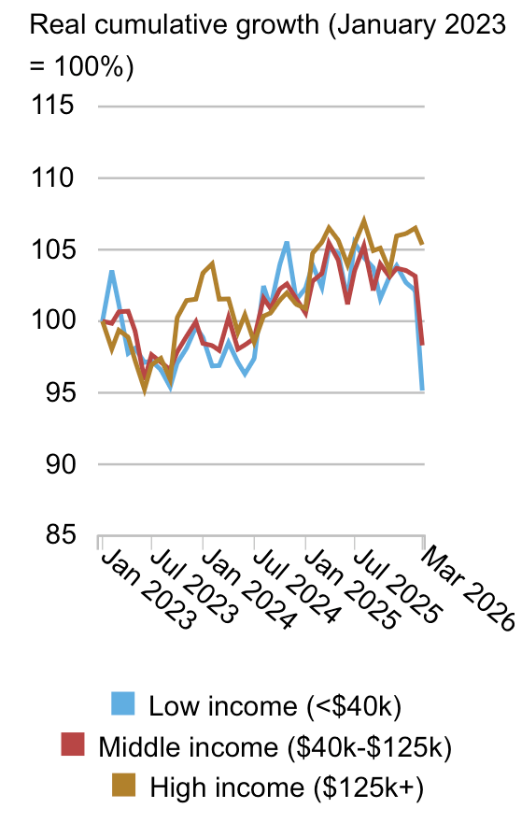
This brings us to the what is likely to be the main driver for market outperformance over the last year – the “K”-shaped economy. As an example, the recent surge in gas prices of up to 50% as a result of the conflict in the Middle East, has resulted in poorer households, defined as those earning less than $40,000, cutting their gas consumption by 7%, but still spending 12% more on gas in March. Higher-income households, defined as those earning $125,000 a year or above, lifted their spending on gas 19% in March, while reducing their overall consumption of gas just 1% (below). Clearly, the low and middle income groups have been disproportionately affects by the rise in gas prices.
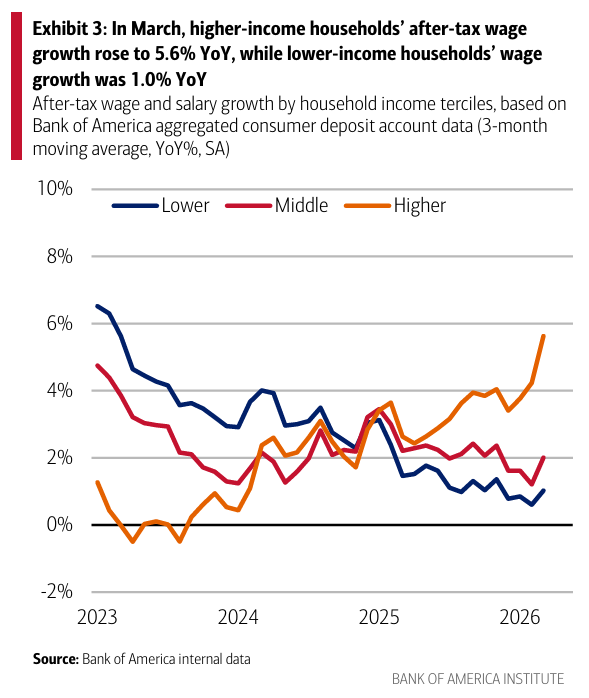
The next question becomes, what does this have to do with the stock market? Recent data published by the Bank of America Institute shows that wealthy Americans have seen their incomes rise at close to double the rate of inflation (~6% vs 3% inflation) this year whereas lower and middle income households saw only 1-2% increases indicating that they are falling behind inflation.
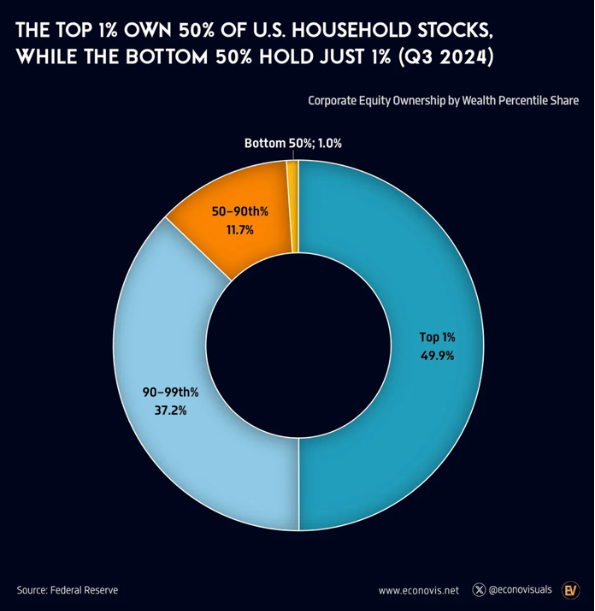
The disparity becomes even more stark when combined with a look at stock market ownership. The wealthiest 10% of households own over 87% of the stock market capitalization with the Top 1% representing almost 50% (below). By contrast, the bottom 50% of US households hold just 1% of the stock market equity. Essentially, the richest households have seen their incomes go up and the value of their equities go up even more. This leads to the strange situation where the wealthy have a lot to feel good about despite geopolitical and economic turmoil. In fact, they are incentivized to buy every dip as it tends to reinforce the wealth gap. They also have the balance sheets to be able to buy in volume. It is important to note that this is not a negative commentary about the behaviour of the wealthy. They are acting in a totally rational manner given the current environment.
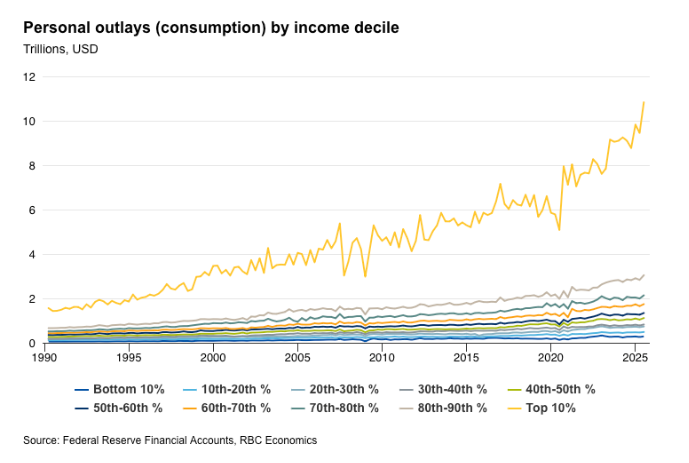
The US economy has become highly dependent on the spending patterns of the rich. The top 10-20% of earners have been driving the majority of the spending in the US by a wide margin (below). Given that consumer consumption accounts for around 70% of US GDP, this spending is essential for the continued prosperity of the country.
INVESTOR TAKEAWAY:
This dynamic is important for investors to monitor. It has proven to be quite resilient in the face of many exogenous shocks – the rich keep spending. The widening of the gap in the “K”-shaped economy has provided the fuel for the markets. If an event begins to change this dynamic, then we are likely to see the market correct quickly. Events such as a dramatic change in tax policy or government regulation are probably prerequisites for change as opposed to trade policy or geopolitical conflict. However, market changes can come from unexpected sources, so investors need to be vigilant.